Minnesota Vikings GM Analysis
A data-driven look at how General Managers Rick Spielman (2012–2021) and Kwesi Adofo-Mensah (2022–2025) built the Vikings through the draft, cap management, and on-field results — using nflverse data, Approximate Value metrics, and OLS regression. Kwesi was fired on January 30, 2026; the Vikings are currently operating with an interim GM.
Project Overview
When Kwesi Adofo-Mensah replaced Rick Spielman as Vikings GM after the 2021 season, it triggered the kind of debate every NFL city loves: is the new guy actually better? Kwesi's tenure ended on January 30, 2026, when he was fired despite the Vikings posting their best regular season in either GM's era in 2024. Rather than rely on hot takes, I used publicly available NFL draft data to build a side-by-side statistical comparison of both GMs across four dimensions — draft quality and hit rate, positional investment, cap stewardship, and their downstream effect on regular season wins.
All draft data comes from the nflverse ecosystem (nfl_data_py). Player quality is measured using Approximate Value (AV), a Pro Football Reference metric that captures career production across positions on a single numerical scale. Win-loss records are sourced from nflverse schedule data (2012–2024). Cap figures are normalized to reflect league-wide spending trends over time.
⚠️ Important Caveats
Kwesi Adofo-Mensah's draft classes (2022–2024) are still early in development — most of
his picks have played only 1–3 seasons. Career AV naturally favors veterans with more
playing time, so his numbers will almost certainly improve over time. This analysis
captures a snapshot of his tenure (2022–2025), not a final verdict — he was
fired on January 30, 2026, with the Vikings' roster and cap situation left to an interim GM.
Additionally, nflverse's dr_av field (team-specific AV) mirrors
car_av for all rows, so departed-player detection relies on 2024 roster
data rather than AV splits.
Spielman: 2012–2021 (10 classes). Kwesi: 2022–2024 (3 classes, still maturing).
Total picks tracked from 2012 through 2024, with career AV and roster status verified.
Draft class AV from years Y-1, Y-2, and Y-3 used to predict wins in year Y via distributed lag OLS.
Players no longer on the 2024 Viking roster are tracked separately — traded, released, or retired — preserving their draft-era AV for comparison.
Results & Visualizations
The charts below walk through the analysis section by section. Click any figure to view it at full resolution. Captions reflect my own read of the data — feel free to draw your own conclusions.
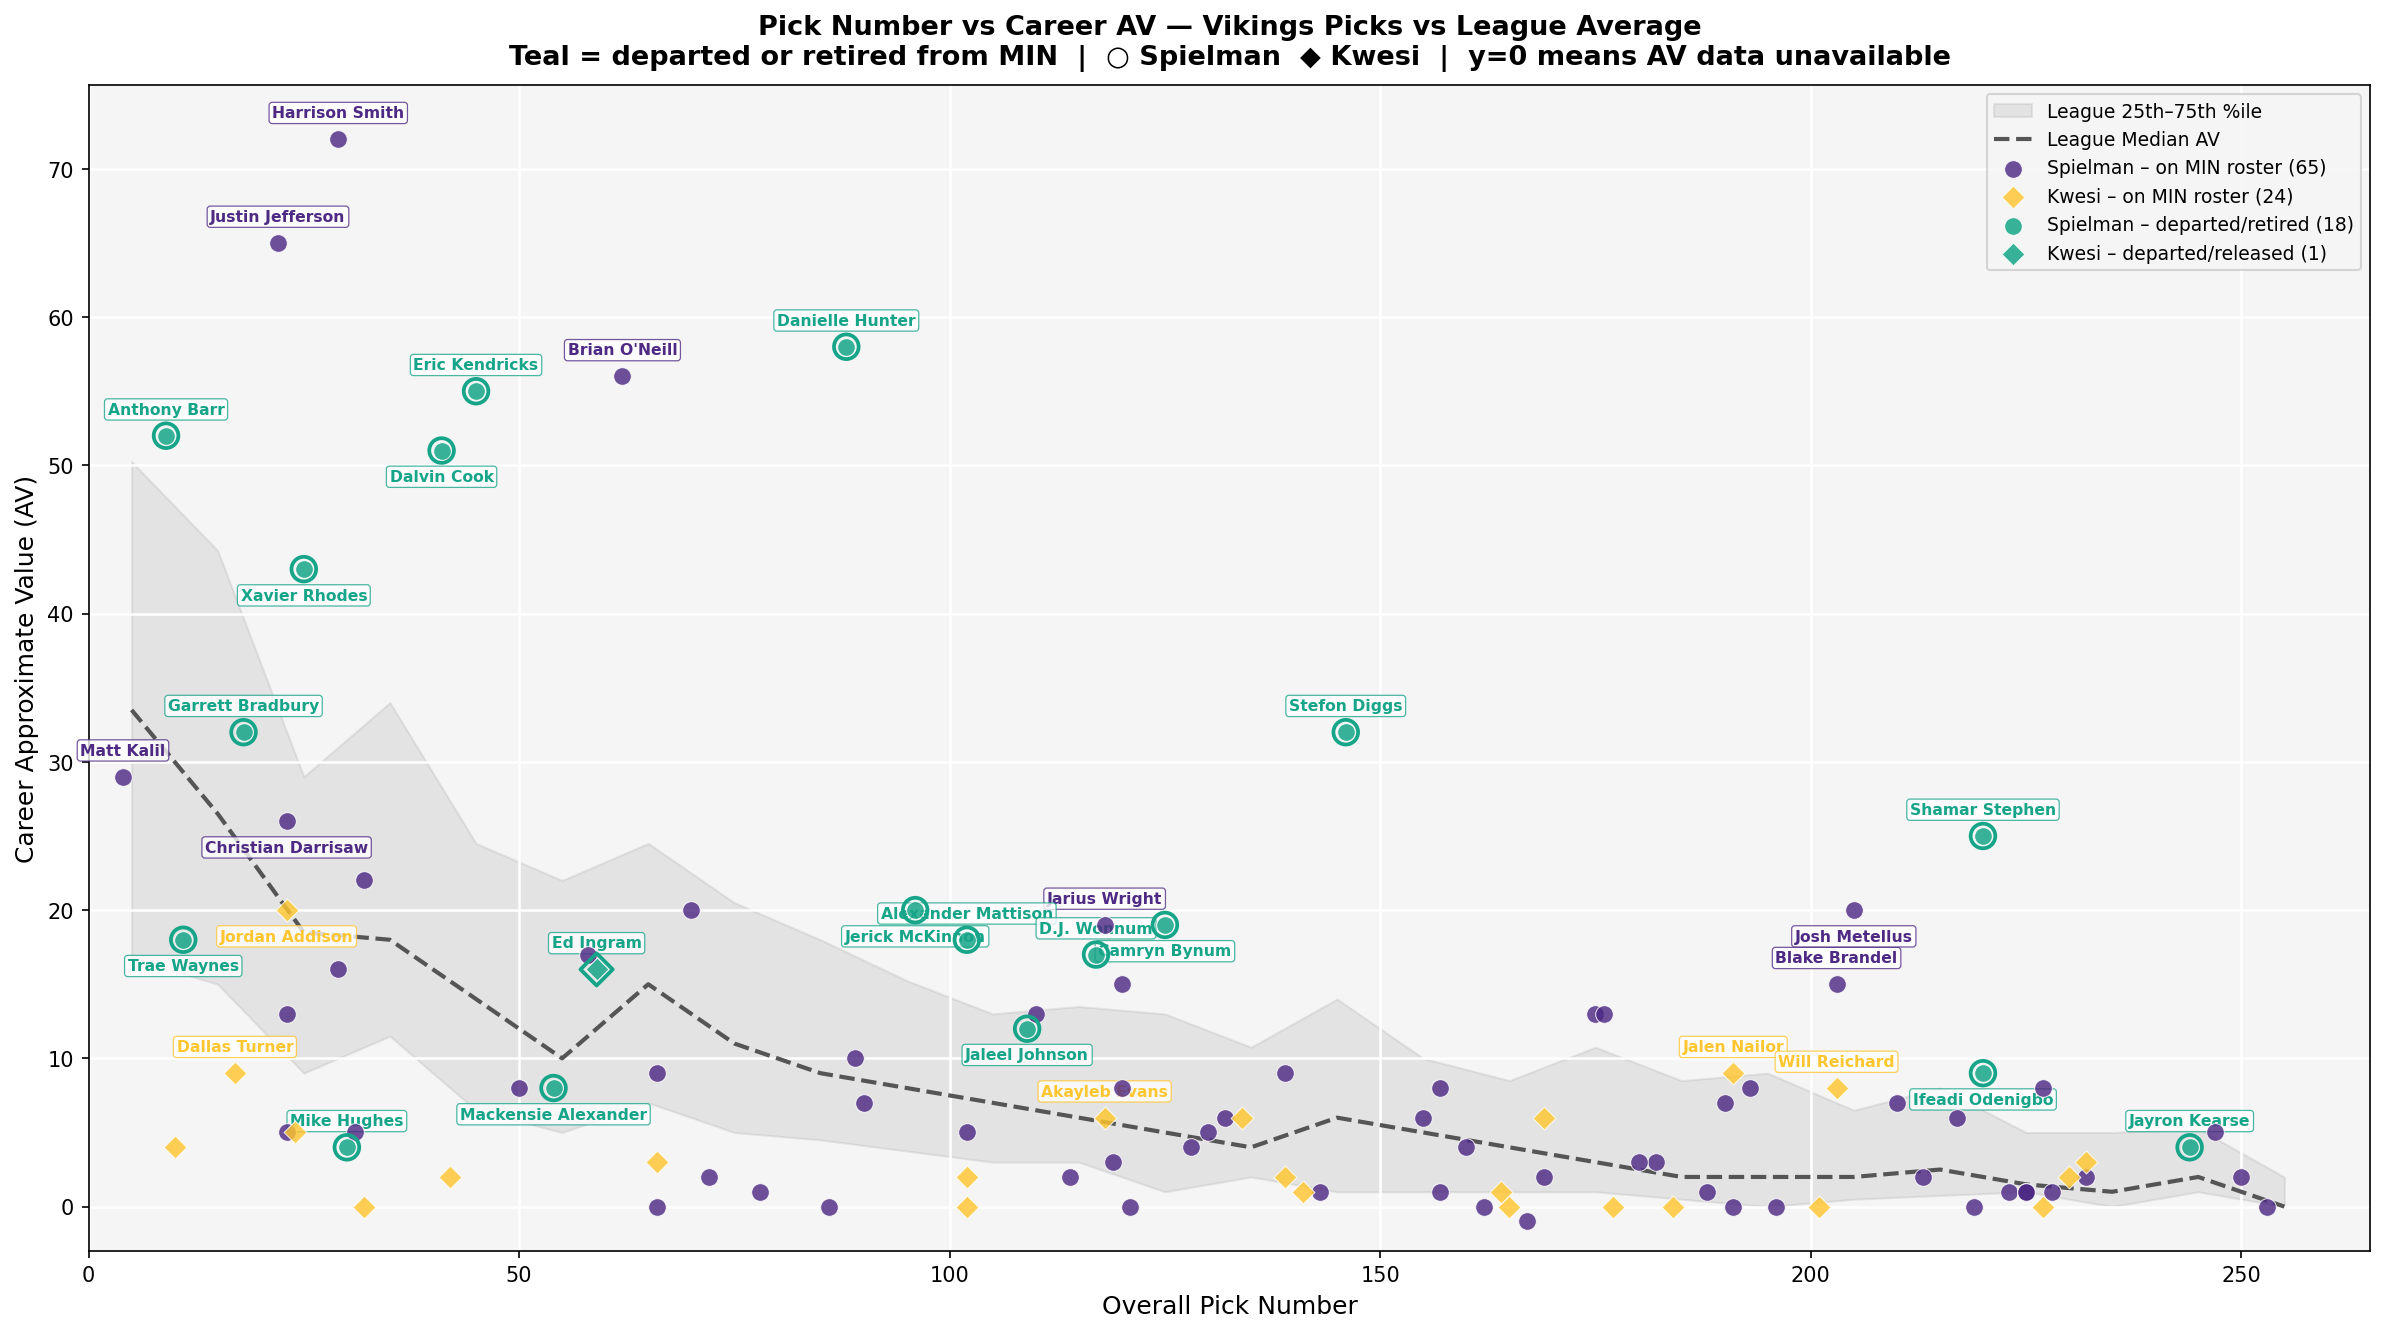
When Spielman connected, he connected well above the league median curve — seldom landing below average, and generating a notable cluster of value in the late second and early third rounds where AV expectations are still meaningful but draft capital is cheaper. His late-round hits, particularly in rounds 6 and 7, are remarkable outliers given how little production those picks typically yield league-wide. Kwesi's picks are too early in their careers to judge fairly — Jordan Addison and Dallas Turner in particular have significant room to climb — but the teal departed-player markers serve as a reminder that some of Spielman's best production walked out the door before the rebuild was complete.
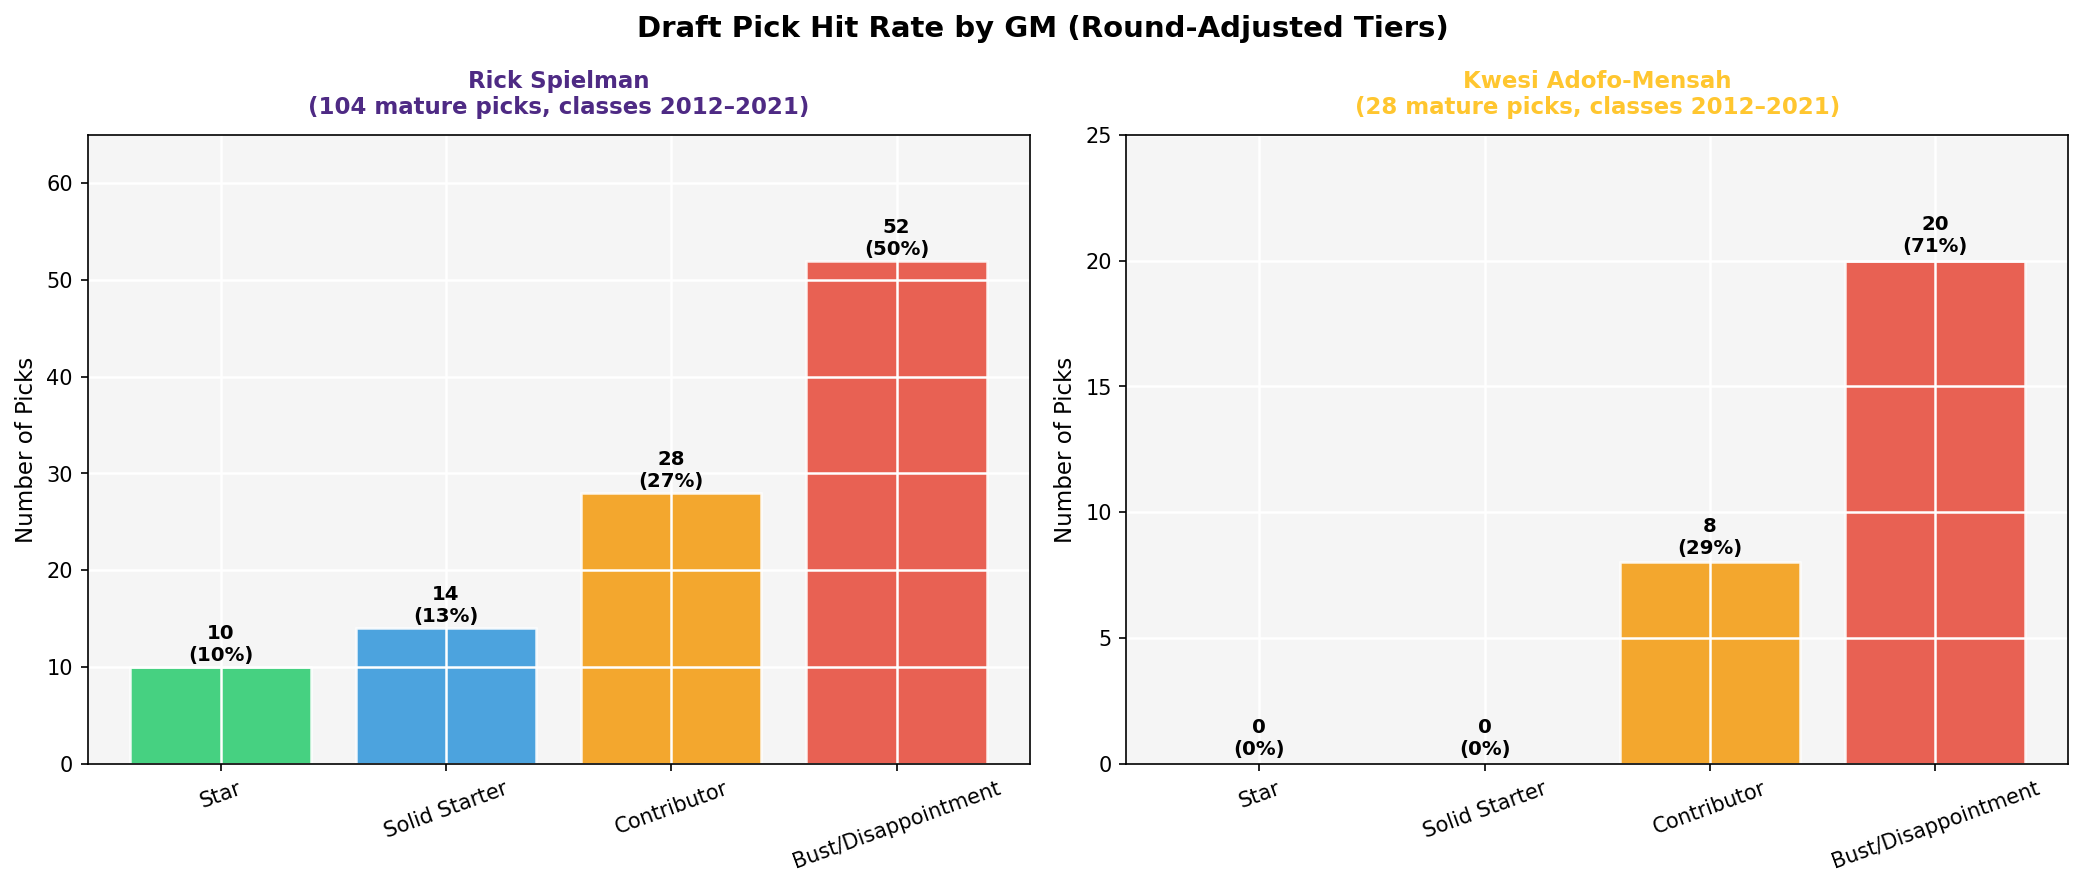
Spielman's hit rate distribution looks about right for a decade-long NFL tenure — a healthy mix of stars, solid starters, contributors, and the inevitable busts that come with any draft. Kwesi's distribution skews heavily toward the lower tiers, but that number carries an asterisk in both directions: his draft classes are only 1–3 seasons old, meaning several players haven't had enough time to establish the career AV that earns a higher designation. The more honest read is that the jury is still fully out on Kwesi's picks, and this chart will look meaningfully different in three years.
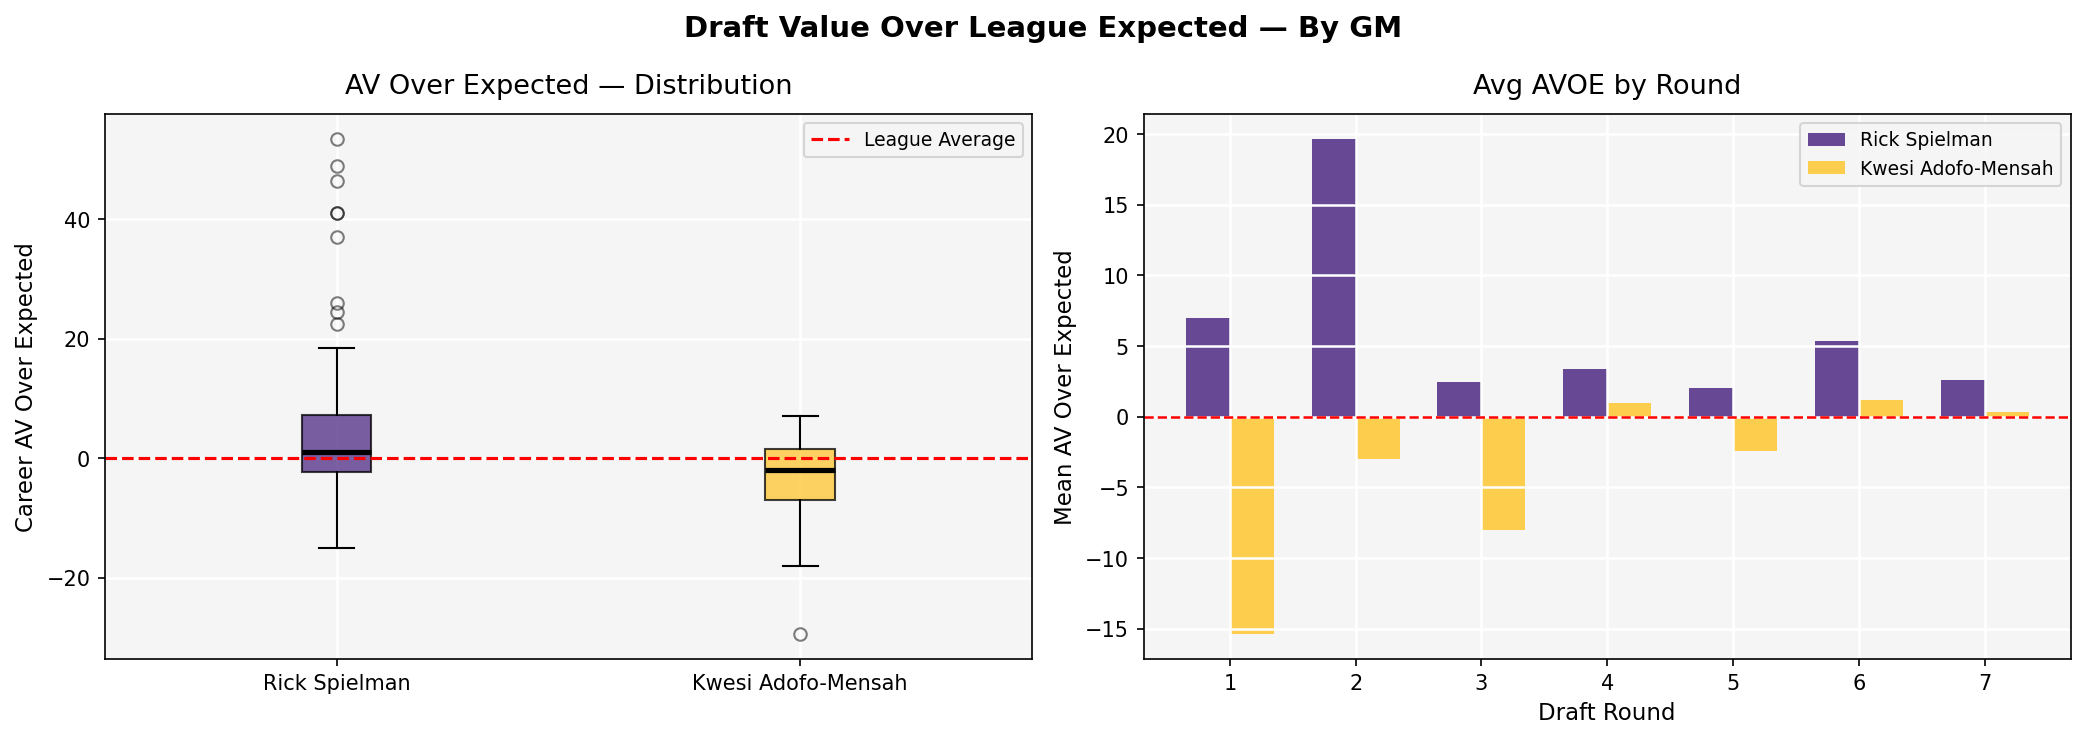
The box plots tell the story cleanly: Spielman's median sits above the league-expected line with notable outliers pulling him further upward, while Kwesi's median sits below it — though young classes with little accumulated AV will drag any GM's distribution negative early. The round-by-round bar chart reinforces a key strategic point: Spielman's willingness to trade down and accumulate picks gave him more chances to capture outlier value, and more of those lottery tickets paid off, particularly in rounds 2 through 4. Volume of opportunities compounded with above-average hit rate is a powerful combination — and this chart shows the returns.
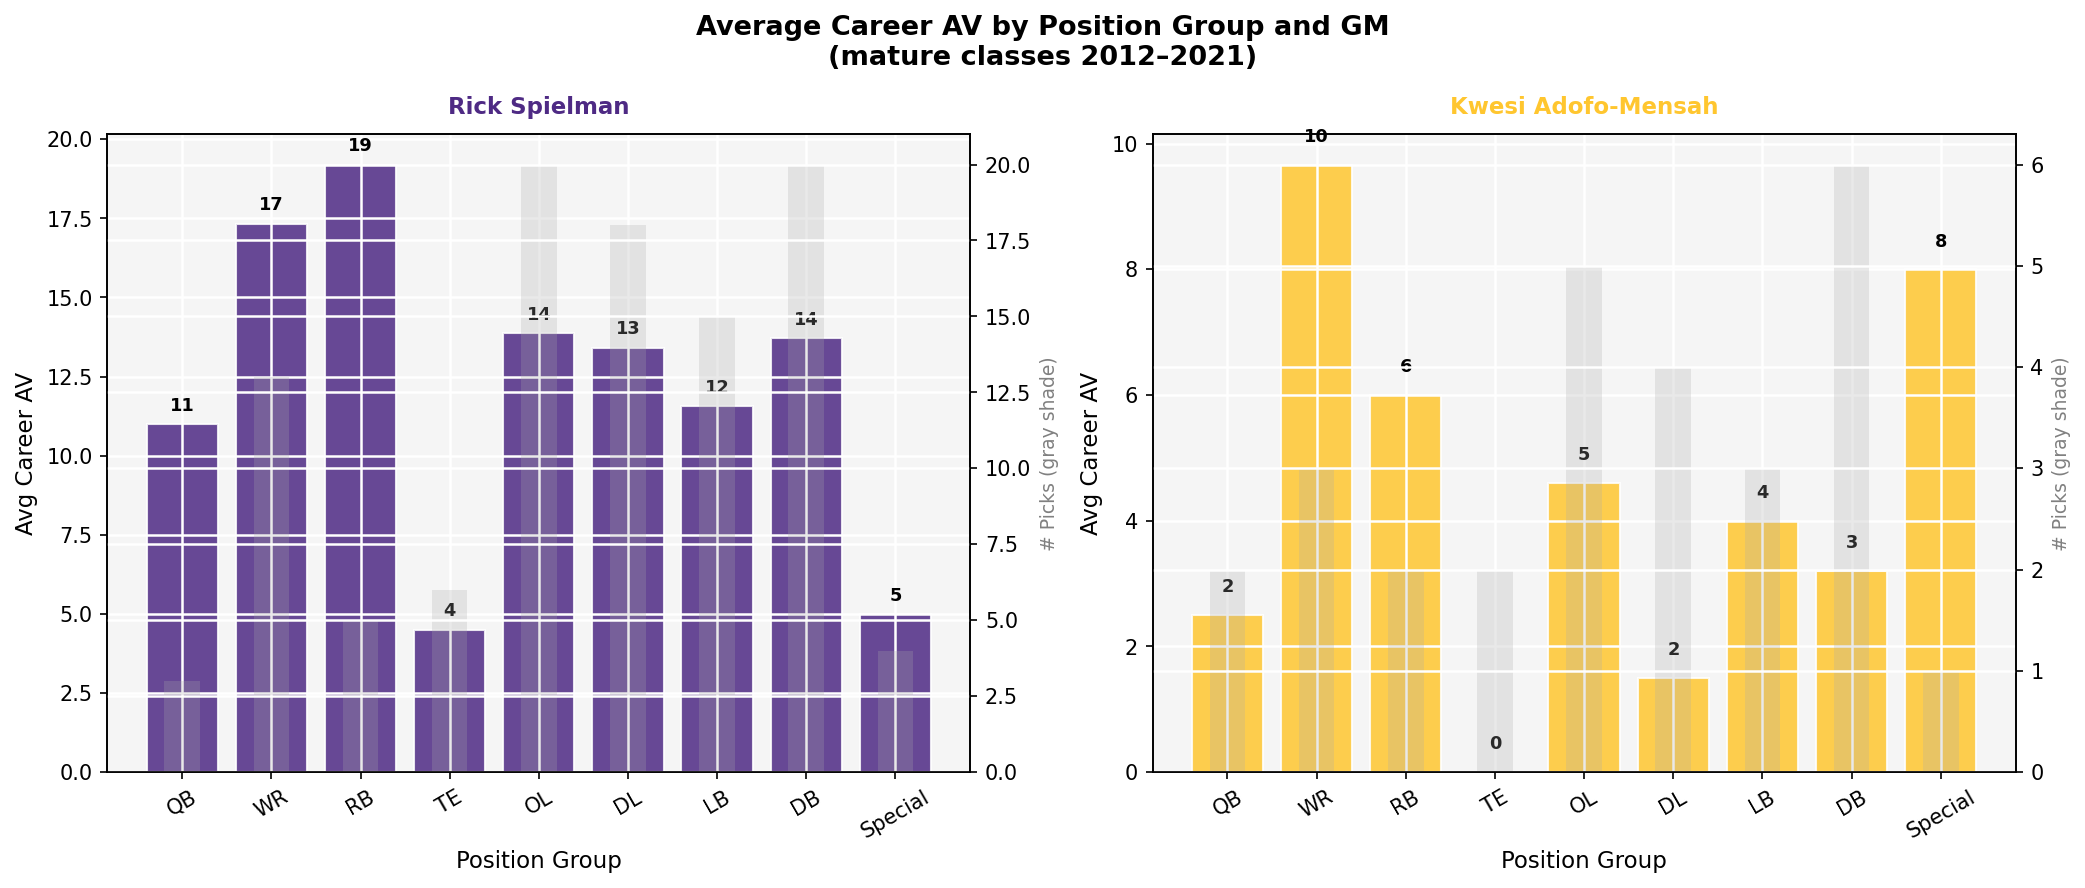
The positional breakdown reflects the coaching philosophies each GM was building around: Spielman spent a decade supplying Mike Zimmer's defense-first system, which shows in his investment across defensive line, linebacker, and secondary. Kwesi inherited Kevin O'Connell's pass-heavy, McVay-influenced offense and has drafted accordingly, with wide receivers representing his highest-AV position group. It's a useful reminder that GMs don't draft in a vacuum — the position group distribution is as much a reflection of the head coach's system as it is of the GM's own philosophy.
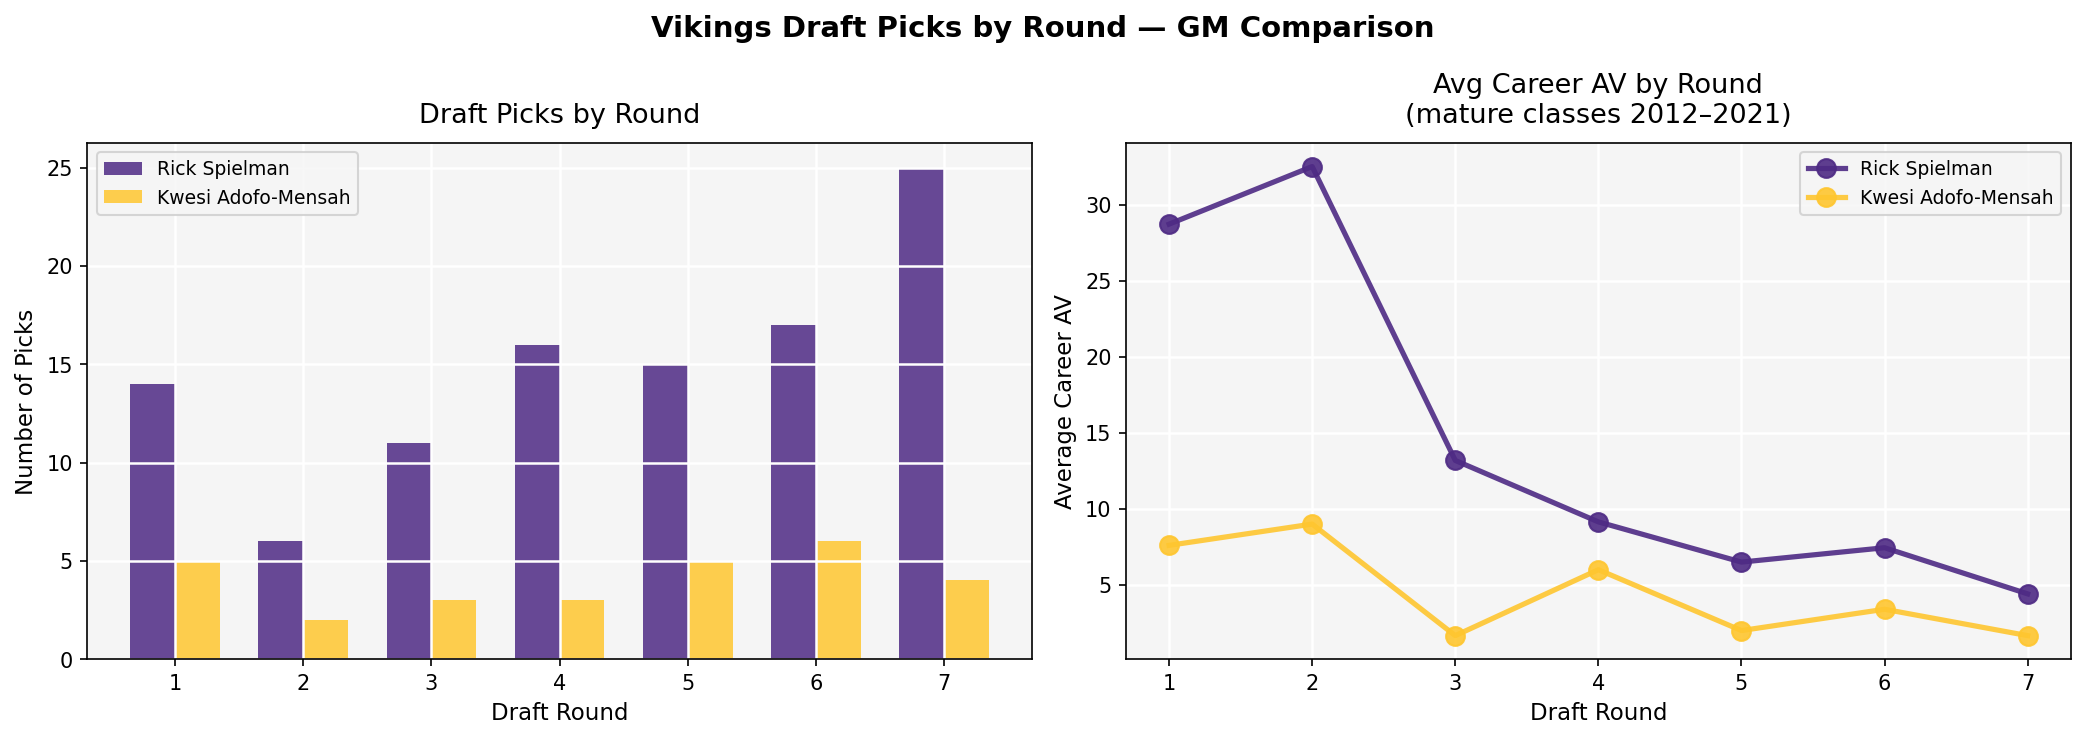
The volume gap across rounds reflects tenure more than strategy — Spielman had 10 draft classes to Kwesi's 3 — but the round distribution reveals a genuine philosophical split. Spielman regularly traded down to accumulate late-round capital, piling up 6th and 7th round picks as a core part of his approach. Kwesi has been explicit about his counter-view: early picks carry compounding value that late-round volume simply can't replicate, a philosophy reflected in his leaner but more top-heavy draft footprint.
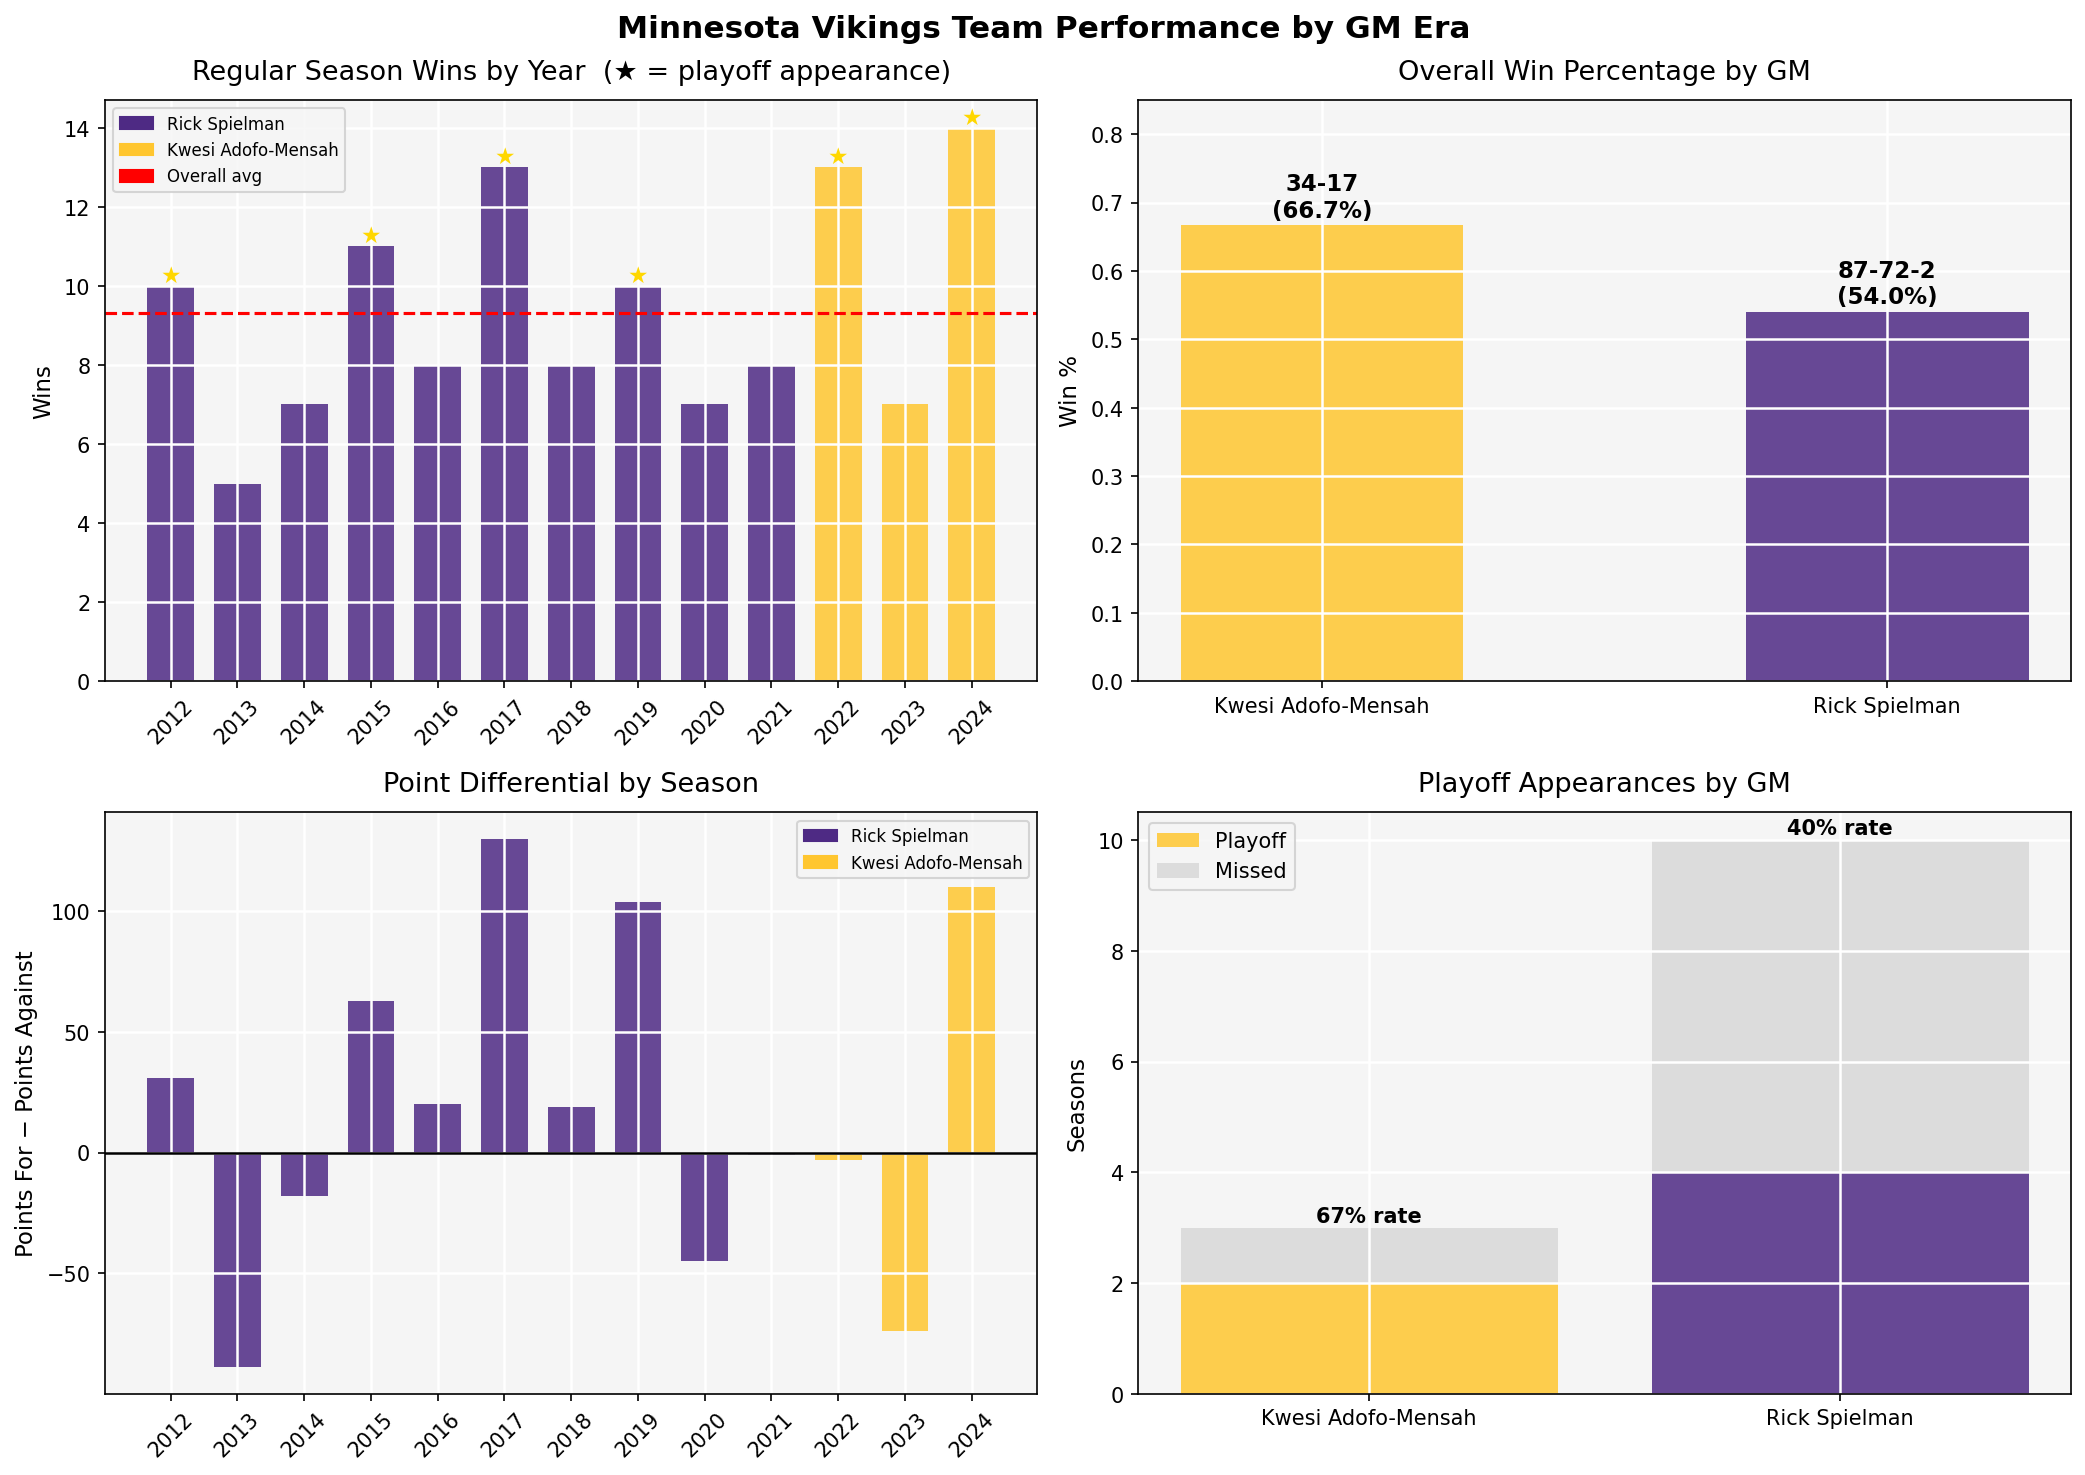
On paper, Kwesi's win percentage and playoff rate both outpace Spielman's — two playoff appearances in three years versus four in ten — yet team performance doesn't map cleanly onto drafting tendencies for either GM, since wins reflect free agency, coaching, health, and schedule as much as draft quality. The most striking data point is 2024: the Vikings' best regular season in either GM's tenure came after Kwesi was dismissed, a result that complicates any simple verdict about his body of work. It's a fitting reminder that building an NFL roster and getting credit for it don't always happen on the same timeline.
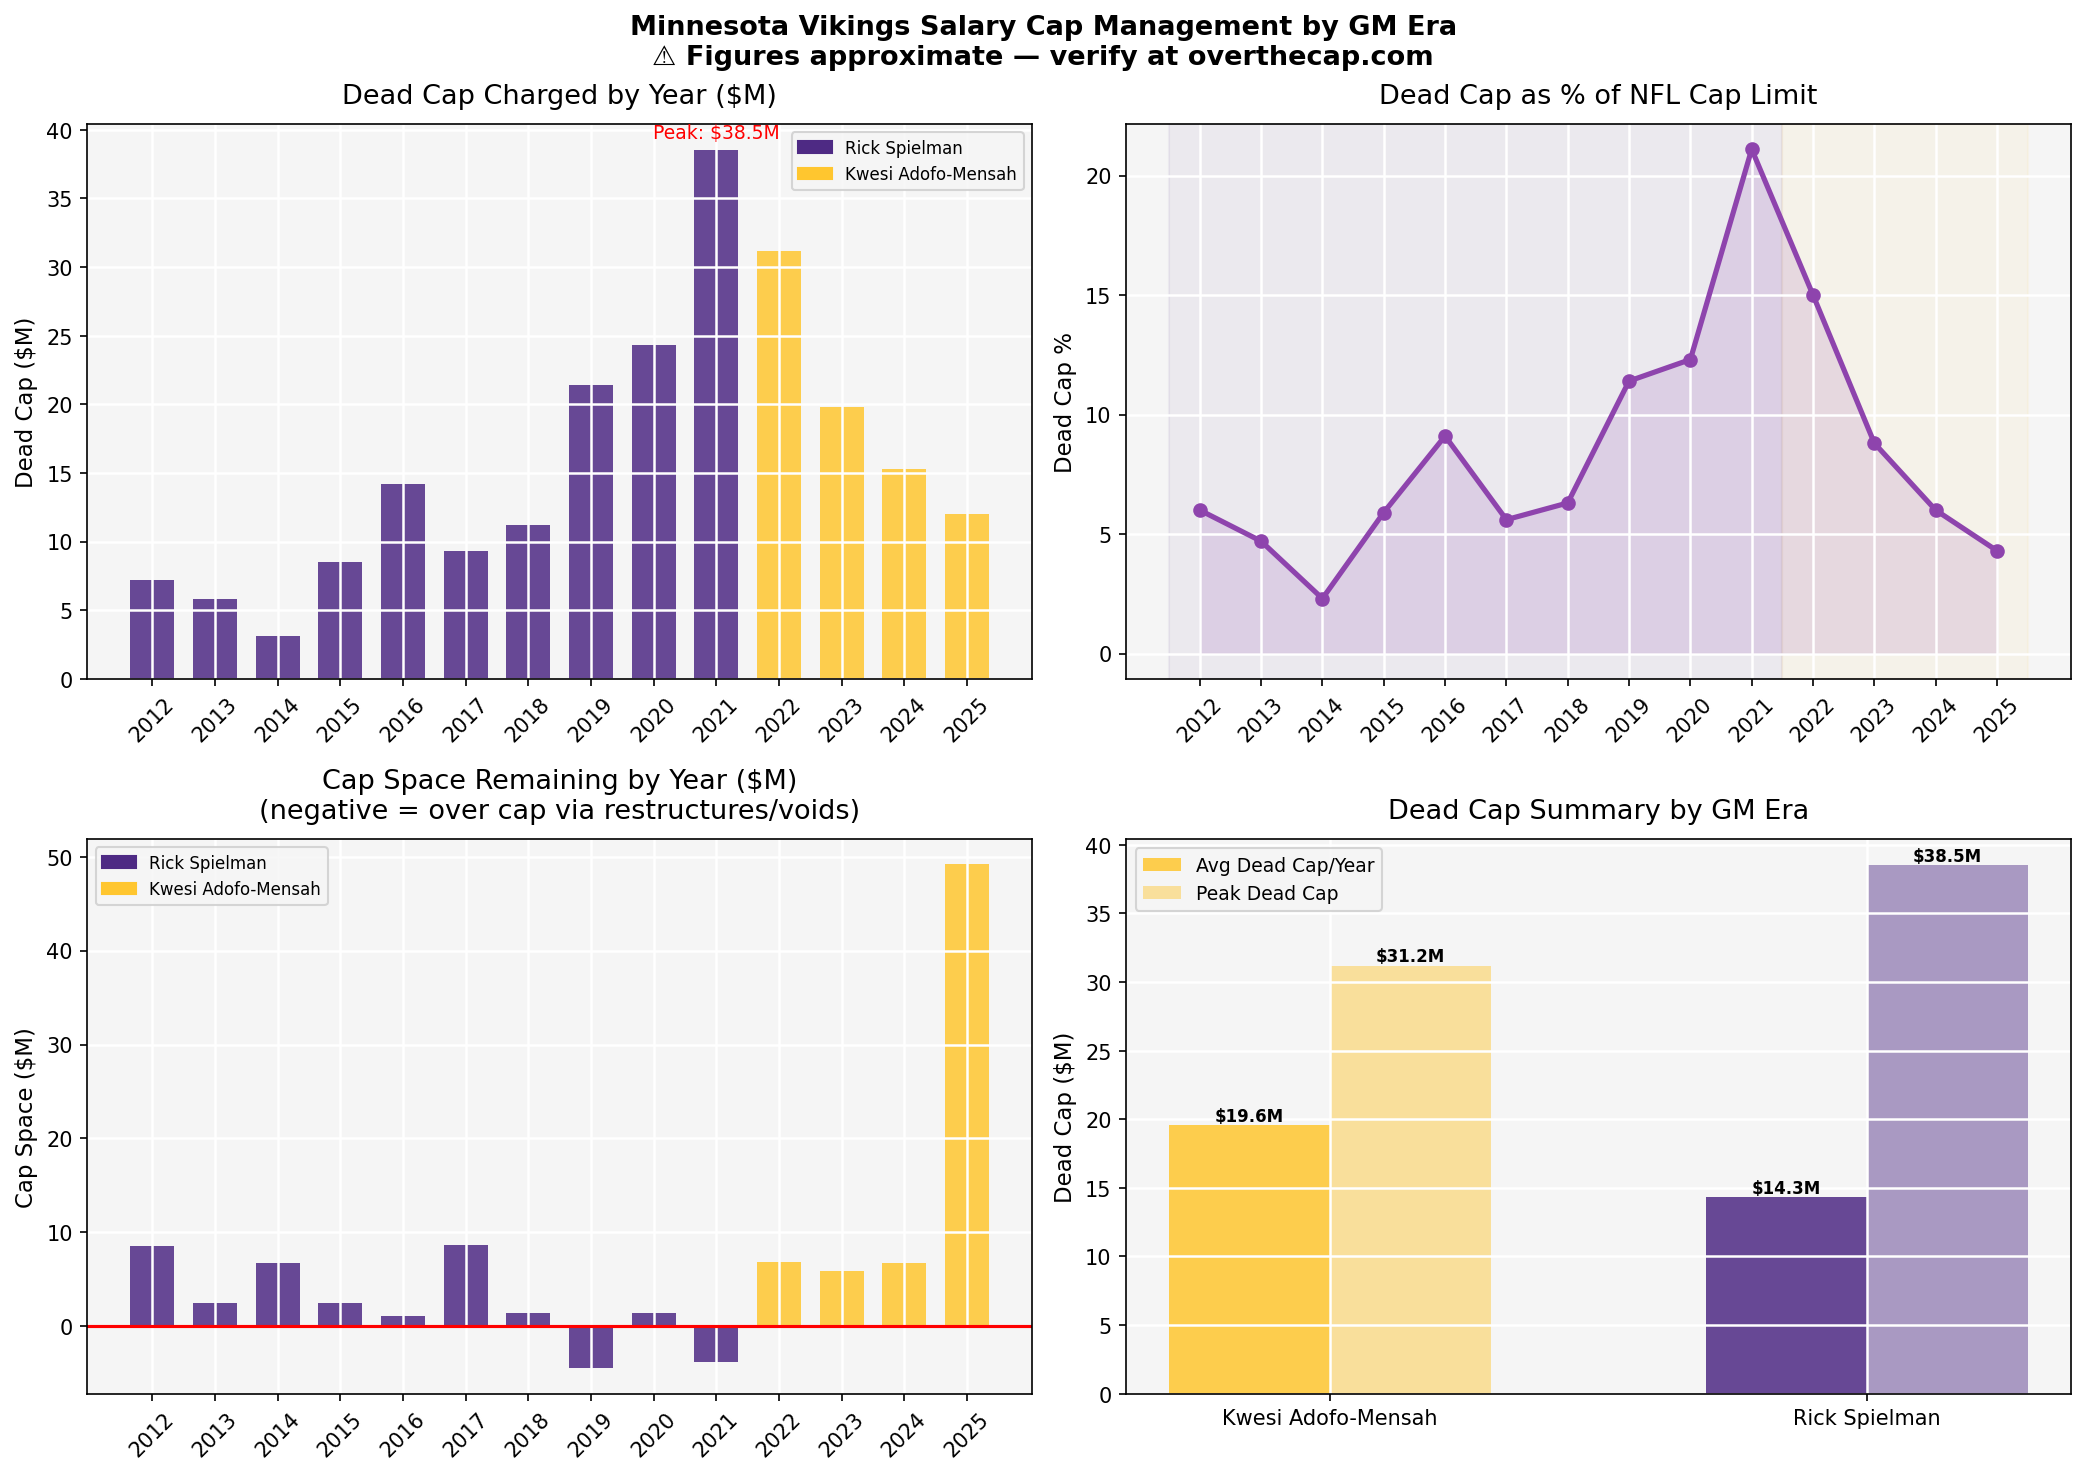
The dead cap spike that greets Kwesi's tenure isn't entirely his doing — Spielman left behind one of the worst cap situations in franchise history, with the Kirk Cousins contract restructure artificially inflating early dead cap figures and skewing a direct comparison. Strip away that inherited mess and the trend line tells a different story: Kwesi was consistently driving dead cap down year over year, and the 2025 cap space figure reflects a roster that is genuinely clean. It's worth noting that Kwesi came to the NFL from a career as a commodities trader on Wall Street — and anecdotally, that financial fluency appears to have translated into a more disciplined approach to cap management than the raw numbers at first suggest.
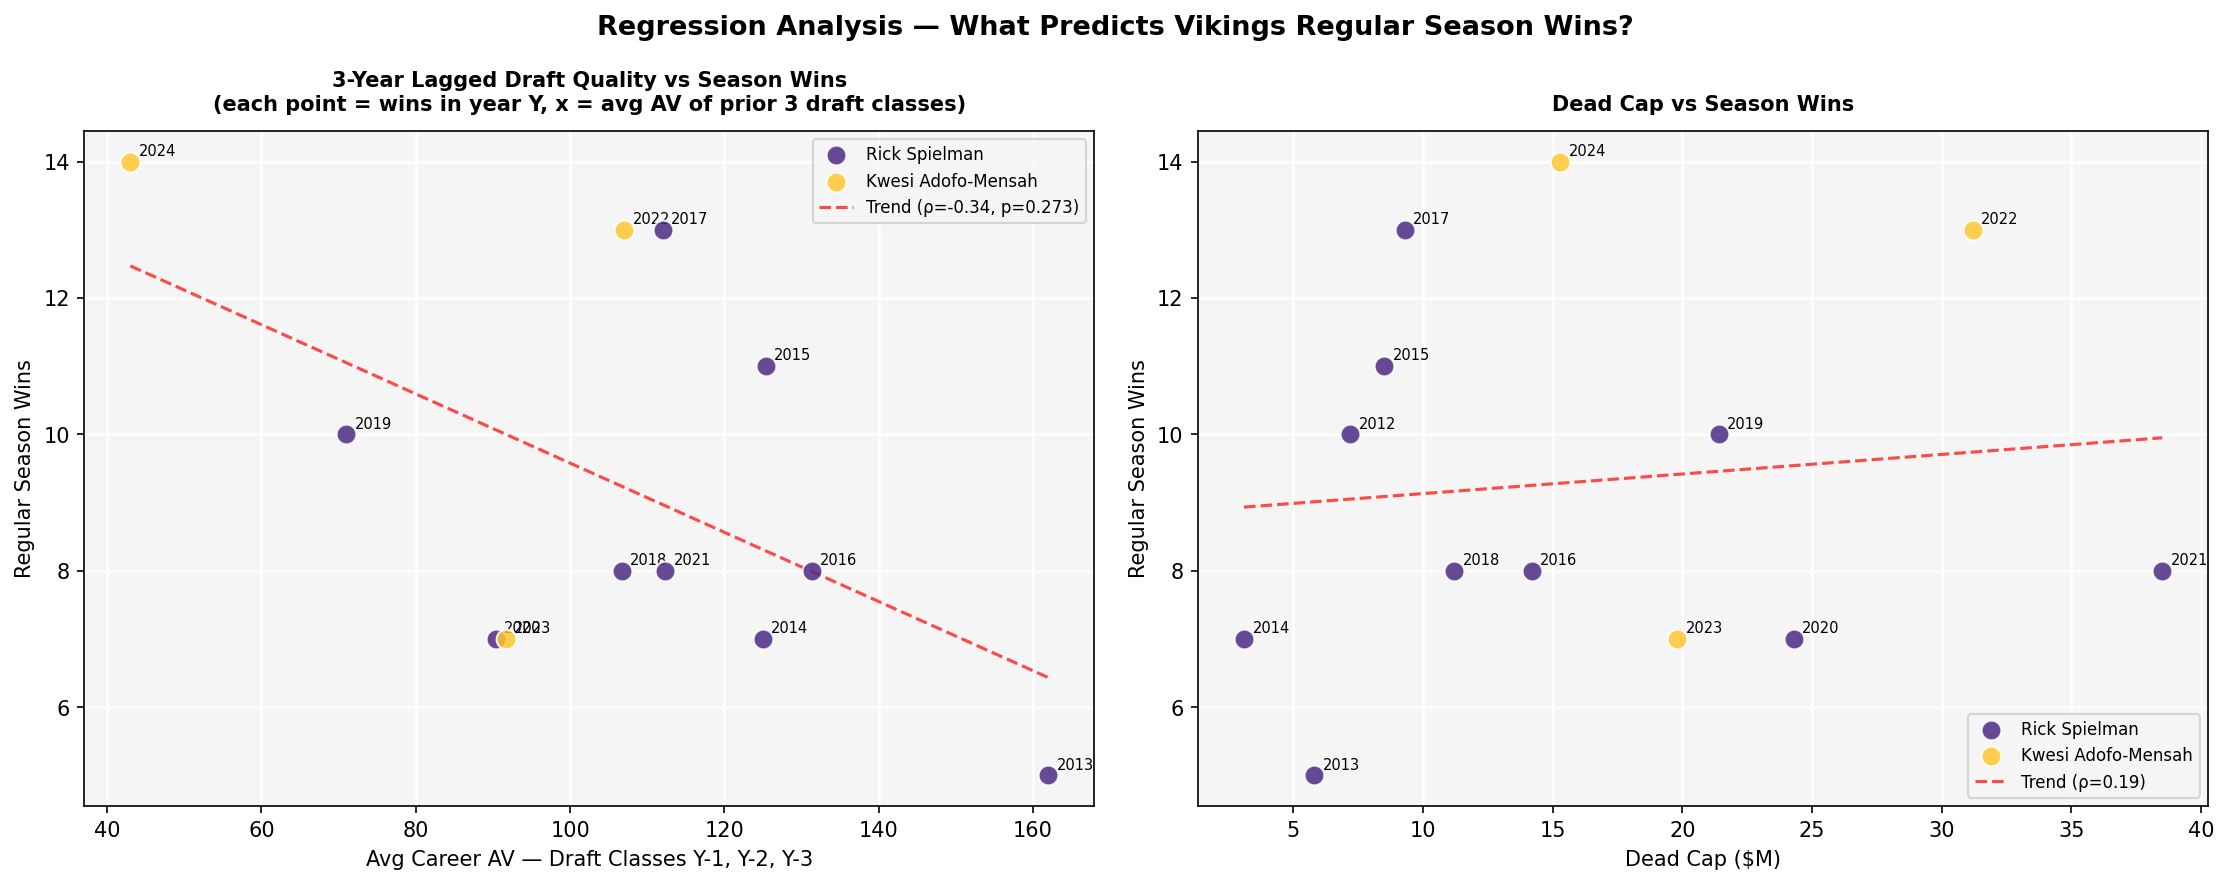
The distributed lag model — regressing wins on average draft class quality from the prior three years — returns a negative but statistically insignificant trend (ρ = -0.34, p = 0.273), which sounds damning until you recognize the confound: high historical draft AV often signals a team that recently held early picks, which means they were recently losing. Spielman's two best seasons, 2015 and 2017 at 13 wins each, anchor the middle of the distribution where the relationship is most plausible, but the sample is too small to draw a firm conclusion. The 2024 data point — 14 wins on very low lagged AV — is the most honest summary of Kwesi's situation: his classes are too young to have accumulated career AV, and the final chapter of this analysis genuinely hasn't been written yet.
Methodology Notes
Draft quality is measured as the sum of Career Approximate Value (car_av) for all players selected in a given draft class. Players who left the Vikings — via trade, release, or retirement — are shown in teal on the scatter plot to distinguish their AV from active contributors; their career AV is preserved so both GMs can be fairly compared even when roster turnover is high.
The regression uses a distributed lag model: wins in year Y are regressed on draft class AV from years Y-1, Y-2, and Y-3, rather than the same-year class. This reflects the reality that rookies rarely contribute immediately — a quality draft class typically shows its full impact within two to three seasons. A second model adds normalized dead cap spend as a control for inherited roster decisions.